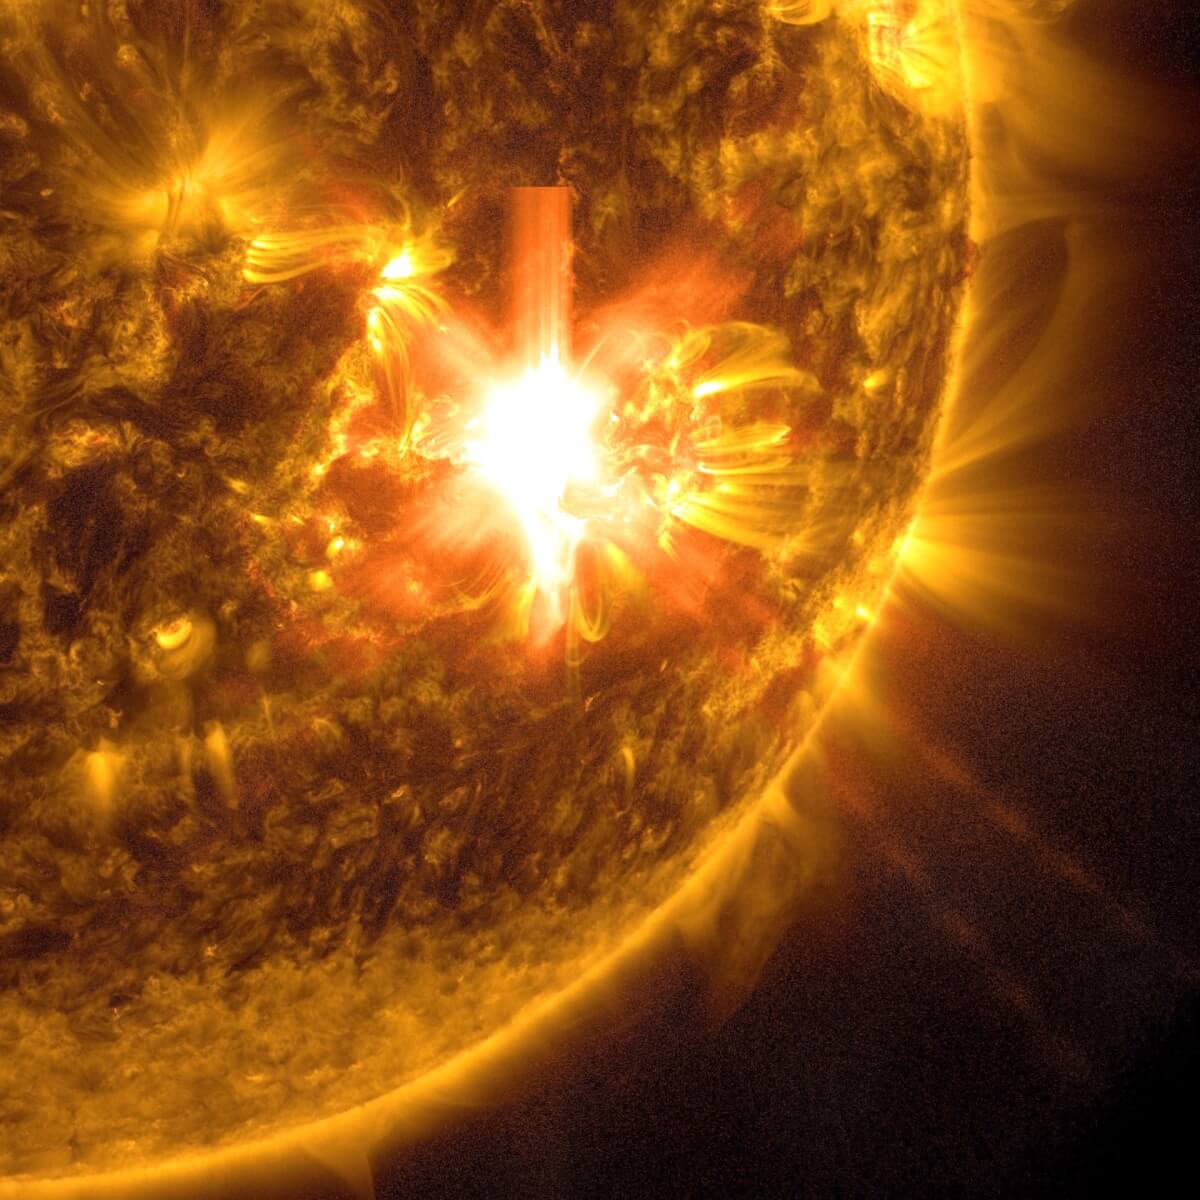
NASA’s Solar Dynamics Observatory captured this image of coronal loops above an active region on the Sun in mid-January 2012. The image was taken in the 171 angstrom wavelength of extreme ultraviolet light. (Credit: NASA/Solar Dynamics Observatory)
In a nutshell
- Scientists discovered that solar flares give warning signs 2-3 hours before they erupt, by showing increased chaotic behavior in loops of super-heated gas above the Sun’s surface
- Using NASA’s Solar Dynamics Observatory satellite data, researchers found these warning signs are most visible in two specific wavelengths of extreme ultraviolet light, with 60-80% prediction accuracy
- This breakthrough could provide crucial extra hours to protect satellites, power grids, and other sensitive technology from the damaging effects of solar storms
SAN DIEGO — A new study reveals that the Sun may give us advance notice before unleashing powerful solar flares, potentially providing crucial hours of warning before these massive eruptions disturb Earth’s technology and communications systems. Looking at data from over 50 major solar flares, researchers discovered telltale changes in the Sun’s outer atmosphere that begin ramping up 2-3 hours before a flare occurs.
Solar flares are intense bursts of radiation that erupt from the Sun’s surface, sending waves of energy and particles hurtling through space. When aimed at Earth, these cosmic tempests can disrupt satellite operations, interfere with radio communications, force airlines to reroute flights, and even cause widespread power grid issues. Currently, our ability to predict exactly when and where flares will occur remains limited, often giving us little time to prepare for their impacts.
“We found that some of the extreme ultraviolet light above active regions flickers erratically for a few hours before a solar flare,” explains Emily Mason, a heliophysicist at Predictive Sciences Inc. in San Diego, California, who helped lead the study, in a statement. “The results are really important for understanding flares and may improve our ability to predict dangerous space weather.”
Research published in The Astrophysical Journal Letters used data from NASA’s Solar Dynamics Observatory, a spacecraft that continuously monitors the Sun in different wavelengths of light. The team examined massive arches of super-heated gas called coronal loops that rise above the Sun’s surface. These loops, which can be millions of miles long, are anchored in magnetically active regions where solar flares tend to originate.
Magnetic field lines in the Sun’s atmosphere can become twisted and tangled, building up enormous amounts of energy, like a rubber band being wound tighter and tighter. When these magnetic fields suddenly reconnect and release their pent-up energy, a solar flare erupts. While scientists have long studied the magnetic conditions that lead to flares, this research took a different approach by examining how the temperature and brightness of coronal loops change during the build-up to an eruption.

The research team analyzed 53 significant flares that occurred between 2011-2022, focusing specifically on flares that happened near the edge of the Sun’s disk, where the arching loops of plasma are clearly visible against the dark background of space. “The Sun’s corona is a dynamic environment, and each solar flare is like a snowflake — every single flare is unique,” says lead author Kara Kniezewski, a graduate student at the Air Force Institute of Technology. “We find that searching for periods of ‘chaotic’ behavior in the coronal loop emission, rather than specific trends, provide a much more consistent metric and may also correlate with how strong a flare will be.”
What emerged was a clear pattern: in the 2-3 hours before a flare, the coronal loops showed significantly more variable and chaotic behavior compared to quiet periods, particularly in two specific wavelengths of light — 131 and 304 Angstroms — which reveal plasma at different temperatures. This enhanced variability suggests that the magnetic field is becoming increasingly unstable as it approaches the breaking point.
The team’s approach differs from previous prediction methods. “A lot of the predictive schemes that have been developed are still predicting the likelihood of flares in a given time period and not necessarily exact timing,” notes study co-author Seth Garland, of the Air Force Institute of Technology. Their method showed 60-80% accuracy in identifying flare conditions 2-6 hours before an event.

Intriguingly, the team also noticed that certain types of flares gave even stronger advance warning signals than others. Flares that remained confined to the Sun’s atmosphere, rather than ejecting material into space, were three times more likely to be preceded by distinct spikes in 131 Angstrom emissions from compact groups of loops near the center of the active region.
The findings, presented at the 245th meeting of the American Astronomical Society, suggest this new approach could help develop more reliable flare prediction methods. “Previous work by other researchers reports some interesting prediction metrics,” notes co-author Vadim Uritsky of NASA’s Goddard Space Flight Center and the Catholic University of Washington, D.C. “We could build on this and come up with a well-tested and, ideally, simpler indicator ready for the leap from research to operations.”
Paper Summary
Methodology Explained
The researchers analyzed solar data from NASA’s Solar Dynamics Observatory satellite, focusing on 53 flares that occurred near the edge of the Sun between 2011-2022. They specifically selected flares rated C5.0 or stronger on the standard classification scale. For comparison, they also studied 30 similar active regions during quiet periods when no flares occurred. They measured the brightness and variability of coronal loops in four different wavelengths of extreme ultraviolet light, creating standardized measurements that could be compared across different events.
Results Breakdown
The study found that solar flare regions showed 2-4 times more variability in their emission patterns compared to quiet regions, particularly in the 131 and 304 Angstrom wavelengths. This enhanced variability typically began about 4 hours before the flare and peaked 1-2 hours before the eruption. The warning signals were most reliable for medium-sized (M-class) flares, correctly identifying them about 80% of the time when looking at 131 Angstrom emissions 2 hours before the event.
Study Limitations
The research only examined flares occurring near the Sun’s edge, where coronal loops are clearly visible. This limited the sample size and may not represent all types of flares. The study also included only four X-class (the strongest) flares, making it difficult to draw firm conclusions about the strongest events. Additionally, the analysis focused only on visible light emissions and did not incorporate magnetic field measurements.
Key Takeaways
The research demonstrates that significant changes in coronal loop behavior occur hours before a flare, potentially providing a new method for flare prediction. The findings suggest that multiple physical processes may be involved in destabilizing the magnetic field before a flare, and that different types of flares may have distinct precursor signatures.
Funding and Disclosures
The research was funded by the Air Force Office of Scientific Research. The authors note that the views expressed do not reflect official guidance or position of the United States Government, Department of Defense, or United States Air Force.
Publication Information
Published in The Astrophysical Journal Letters, Volume 977, L29 (12pp), December 10, 2024. DOI: https://doi.org/10.3847/2041-8213/ad94dd